mrtrench
Sky Blue Hero
- Joined
- Aug 17, 2008
- Messages
- 5,119
- Reaction score
- 4,241
Would be good to have this graph as a sticky, Nick.


Follow along with the video below to see how to install our site as a web app on your home screen.
Note: This feature may not be available in some browsers.


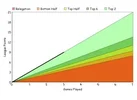
17 wins 14 draws until were in the play offs!
17 wins, 14 draws 12 defeats doesnt sound too difficult does it?? the benefits of getting off to a flyer.
Less than a 40% win rate - and Mogga has hit 40% in every job hes had


As Mogga sez we will have to see how the shite pitches in the bad weather months play out with the team, thats why he is still looking to add to the teamIF we play the same way every game and dont panic chances are losses will be few and far between. so hopefully no big slumps at any rate
Has he pinched your job?You doing this then mate?
Every season at this stage there are 24 sets of fans (i.e. each team) saying "it's not difficult"...& on paper they are absolutely right...in reality they can't ALL be right!No its not difficult at all.
I was saying to my dad after the Wigan game that we cant go on our pathetic annual 10 games without a win streak that we have. We just need to pick points up consistently albeit 3pts or 1 pt
If we lose 1 game make sure we don't lose the next!
Has he pinched your job?
...onwards & upwards PUSB
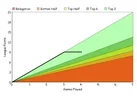


IF we play the same way every game and dont panic chances are losses will be few

No, if we play the same way every game, opposing teams will figure us out and we will lose plenty.
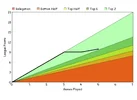
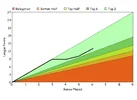
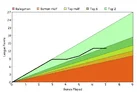
Could do with two wins in a row really yo get us back up there!View attachment 4610
Scunthorpe 1 - 0 Coventry City
It's not just what we do that influences the graph but also what our rivals do.
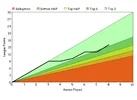

How do you figure that? It's only based on our results.
Well technically you are correct if the vertical axis remains constant. But the coloured bands represent our league position so the vertical axis (points needed to be in a certain band) may have to be adjusted as the season goes on based on the results and the league standings because a different number of points may be needed to be in a certain band.
Well technically you are correct if the vertical axis remains constant. But the coloured bands represent our league position so the vertical axis (points needed to be in a certain band) may have to be adjusted as the season goes on based on the results and the league standings because a different number of points may be needed to be in a certain band.
It is a point count...In which case I apologise, I thought it was a point count.

I'm pretty sure the person who made it just done the bands on the average points needed to be in that position based on previous seasons and not adjustable based on other results.Well technically you are correct if the vertical axis remains constant. But the coloured bands represent our league position so the vertical axis (points needed to be in a certain band) may have to be adjusted as the season goes on based on the results and the league standings because a different number of points may be needed to be in a certain band.
It is a point count...
Average points needed to fall withing those parameters. Right?
Sent from my SM-G920F using Tapatalk
Not disputing the line is a points count but the coloured bands still represent our league position and the points needed to be in a certain position will vary over the season depending what the other clubs do.It is a point count...
Average points needed to fall withing those parameters. Right?