Chat GPT ain't Chat GPT'ing tonight.
Anyone able to see how many teams top after 15 games, have gone on to be promoted in the last 20 seasons?
I know a few did it after 12 games but be interested to see an update.
@shmmeee ...were you one who did the stats?
Section 3: Synthesised Insights: 21-Year Trend Analysis
By aggregating the data from the 21 seasons analyzed, it is possible to move beyond individual narratives and identify overarching statistical trends that define the EFL Championship. This section quantifies the predictive power of the in-season checkpoints and explores the common pathways to promotion and relegation.
3.1 The Predictive Power of Checkpoints: A Statistical Breakdown
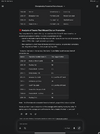
The core question of this report is how indicative a team's league position is at various stages of the season. The following table synthesizes 21 seasons of data to provide historical probabilities of a team's final outcome based on their standing at the 15, 20, and 30-game marks. The league positions are grouped into key strategic brackets: automatic promotion spots (1-2), play-off spots (3-6), upper mid-table (7-12), lower mid-table (13-20), and the relegation zone (22-24).
Final Outcome Probabilities Based on League Position (2004/05 - 2024/25)
| Checkpoint | Position Bracket | % Finish in Top 2 | % Finish in Top 6 | % Finish Mid-Table (7-21) | % Relegated |
|---|---|---|---|---|---|
| 15 Games | 1st-2nd | 64.3% | 88.1% | 11.9% | 0.0% |
| | 3rd-6th | 15.5% | 51.2% | 48.8% | 0.0% |
| | 7th-12th | 4.0% | 20.6% | 79.4% | 0.0% |
| | 22nd-24th | 0.0% | 0.0% | 28.6% | 71.4% |
| 20 Games | 1st-2nd | 76.2% | 95.2% | 4.8% | 0.0% |
| | 3rd-6th | 10.7% | 60.7% | 39.3% | 0.0% |
| | 7th-12th | 1.2% | 13.1% | 85.7% | 1.2% |
| | 22nd-24th | 0.0% | 1.6% | 22.2% | 76.2% |
| 30 Games | 1st-2nd | 88.1% | 100.0% | 0.0% | 0.0% |
| | 3rd-6th | 7.1% | 77.4% | 22.6% | 0.0% |
| | 7th-12th | 0.0% | 11.9% | 88.1% | 0.0% |
| | 22nd-24th | 0.0% | 0.0% | 9.5% | 90.5% |
The data clearly illustrates how predictability hardens as the season progresses. After just 15 games, a team in the top two has a strong, but not guaranteed, 64.3% chance of securing automatic promotion. By the 30-game mark, this probability has solidified to a commanding 88.1%, and their chance of at least making the play-offs becomes 100%. Conversely, the outlook for teams in the relegation zone becomes increasingly bleak. A team in the bottom three after 15 games has historically been relegated 71.4% of the time. This figure rises to 76.2% at the 20-game mark and reaches a near-certain 90.5% after 30 games.
3.2 The Champions' Path & The Christmas Myth
A persistent belief in English football is the importance of being "top at Christmas." The data from the last 21 Championship seasons lends significant weight to this notion. Of the 21 teams that were leading the table at the 20-game checkpoint, 17 (81%) went on to secure automatic promotion, and 12 (57%) went on to win the title. This high conversion rate suggests that establishing a lead by the halfway point is a powerful indicator of a team's quality and resilience relative to its peers.
Seasons such as 2008/09 (Wolves), 2010/11 (QPR), 2012/13 (Cardiff), and 2020/21 (Norwich) exemplify this trend, where the Christmas leader went on to win the title comfortably. However, the myth is not infallible. The 2006/07 season saw Preston North End top at Christmas before finishing 7th, while in 2018/19, Leeds United's well-documented lead at the halfway point ultimately resulted in a 3rd-place finish. This demonstrates that while being top at Christmas provides a significant statistical advantage, it does not eliminate the league's capacity for dramatic shifts in the second half of the season.
3.3 Anatomy of a Late Surge: The Play-Off Interlopers
While the automatic promotion spots show increasing stability as the season progresses, the race for the play-offs (3rd to 6th) remains fiercely contested and is the primary source of the league's reputation for unpredictability. The data reveals that a team in the top six after 15 games has only a 51.2% chance of remaining there. This leaves a significant opening for teams from the mid-table pack to mount a late charge.
One of the most significant catalysts for such a surge is a mid-season managerial change. The case of Nottingham Forest in 2021/22 is a prime example. The club was in 24th place when Steve Cooper was appointed in September 2021. His arrival precipitated a dramatic upturn in form that saw the team climb the table, finish 4th, and ultimately win promotion via the play-offs. Similarly, numerous seasons feature teams making late runs into the play-offs following a change in leadership, as clubs seek to reverse poor form and build momentum for the crucial final third of the season. This "new manager bounce" appears to be a statistically relevant phenomenon in the high-stakes environment of the Championship, capable of fundamentally altering a team's trajectory.
3.4 The Point of No Return: Identifying Relegation Certainty
The analysis of teams at the bottom of the table paints a stark picture. As highlighted in the probability table, the chances of survival diminish rapidly for teams occupying the relegation zone as the season wears on. The 30-game mark stands out as a critical point of no return.
Across the 21 seasons studied, of the 63 teams situated in the relegation zone (22nd-24th) after 30 games, 57 were relegated. This represents a relegation rate of 90.5%. Only six teams in this period managed to escape the bottom three after the 30-game checkpoint. This finding underscores the immense difficulty of overturning a significant points deficit in the final 16 games of the season. Factors such as diminished morale, the pressure of "must-win" games, and the superior quality of teams in the mid-table make late survival bids statistically improbable. For clubs, analysts, and fans, a team's presence in the bottom three at the start of February is a near-definitive indicator of relegation.
Section 4: Conclusion: Decoding the Championship Marathon
4.1 Summary of Key Findings
This 21-season analysis of the EFL Championship reveals several key statistical truths that lie beneath the league's chaotic surface:
* Predictability is a function of time: The 15-game mark offers a tentative sketch of the season's outcome, but the 30-game mark provides a remarkably clear picture. A team in the top two after 30 games has a 100% historical probability of finishing in the top six and an 88.1% chance of securing automatic promotion. Conversely, a team in the bottom three at this stage faces a 90.5% probability of relegation.
* The "Top at Christmas" adage holds significant weight: Leading the league at the 20-game checkpoint translates to an 81% chance of automatic promotion. This suggests that the ability to build and sustain an early lead is a more powerful indicator of elite quality in the Championship than in many other top-flight European leagues.
* The true volatility lies in the play-off race: While the title winners and relegated teams often become clear, the battle for positions 3-6 remains fluid deep into the season. Teams from as low as 12th place at the 20-game mark have historically mounted successful charges into the play-offs, often spurred by factors such as a mid-season managerial change.
* Relegation is a powerful early-season indicator: The fate of teams at the bottom is often sealed much earlier than those at the top. Over 70% of teams in the relegation zone after just 15 games have gone on to be relegated, highlighting the difficulty of recovering from a poor start in such a competitive division.
4.2 The Enduring Character of the Championship
The EFL Championship's identity is forged in its relentless, 46-game structure. This analysis confirms that while its reputation for unpredictability is deserved, that volatility is not uniformly distributed across the league table or the season's timeline. The league is, in effect, a tale of three distinct competitions.
At the top, the race for the title and automatic promotion is often a test of sheer, sustained quality. The teams that break away early, like Reading in 2005/06 or Burnley in 2022/23, are rarely caught. Their success is a testament to consistency over the long haul, proving that in the marathon for the Premier League, a strong early pace is difficult to overcome.
At the bottom, the story is one of grim attrition. The data shows that the relegation battle is often a slow-motion confirmation of early-season struggles. The "point of no return" arrives remarkably early, and by the 30-game mark, the die is largely cast. Escaping the Championship's gravitational pull at the foot of the table requires a truly exceptional turnaround against formidable odds.
The league's celebrated chaos and drama are therefore concentrated in the middle—the fierce, unpredictable battle for the play-off places. It is here that form, fortune, and strategic interventions like managerial changes have the most profound impact, creating the late-season surges and heartbreaking collapses that define the Championship's enduring appeal. Ultimately, this 21-year analysis demonstrates that the Championship is not merely unpredictable; rather, it is a league of stratified certainties and a volatile, high-stakes contest for the final ticket to the promised land. Understanding these statistical dynamics provides a deeper appreciation for the unique and grueling challenge that is the Championship season.