SeaSeeEffCee
Well-Known Member
Not the best for us in terms of automatic promotion ambitions, but solid all the same. Very tight league this year, no stand out sides.
I disagree, if it wasn't worth much then every single bookie going wouldn't have been using this sort of data for years. The main issue with it is that is tracks long term trends which can mean that sometimes the data won't feel like it's "come true' over the course of a single season.We know from last season that xG is not really worth that much, we had a higher xG last season
That's not really how it works. xG tables take into account xG both for and against, so if you were winning 1-0 every week yeah maybe your xG would be low, but you'd expect the xGA to be equally low. If you were winning games 1-0 but your xGA was much higher than your xG then you'd probably be getting incredibly lucky most weeks.You can win the league by winning every match 1 - 0.
Your attacking stats could be poor and your expected goals would be extremely low.
It's the results that matter... If these things meant anything, we'd all be doing well on accumulators every week
That's not how it works. It's a predictive model based over an extended period of time. Bookies use to to figure out long term trends, which are then supplemented by situational information in order to calculate odds. In terms of individuals games there are too many uncontrollable, unreliable elements to a game of football for the data to be blindly applied to singular games as xG over a single game often won't be properly reflected in the scoreline.What the fuck is this nonsense all about? You can have more points than other teams yet they’re top- yeah ok then
as for the comment about the bookies, if this stuff was true then everyone would be using it and putting the bookies out of business
Would be nice if people didn't instantly dismiss stuff as rubbish just because it doesn't paint us to be the best team in the history of football though.
Thank you for your worthwhile contribution to this thread. It’s goes nicely with your other completely pointless one earlier too. See we could try and have an actual discussion, e.g. the intended function of an Internet forum, or you know you can continue to add absolutely nothing by making offhand remarks about something completely unrelated to try and score internet points, as per.bought to you by the guy who instantly dismiss stuff as rubbish just because we conceed a goal ?
We’re the best side in the league though apparently
Again, absolutely zero relevance to this thread. Thanks for wasting all our time with your petty grudges.to be fair, you could well be right with this one
Again, absolutely zero relevance to this thread. Thanks for wasting all our time with your petty grudges.
Those that out perform the data, it eventually catches up with them & vice versa - obviously there are always going to be exceptions but on the whole it does make a difference.
We are out performing the chances we are making & it may catch up with us.
We are missing a lot of the chances we are making, we dominate possession in most games we play, we could be top but we're not, yet !!Those that out perform the data, it eventually catches up with them & vice versa - obviously there are always going to be exceptions but on the whole it does make a difference.
We are out performing the chances we are making & it may catch up with us.
What on earth is this thread
That's not how it works but I can see you're going to make absolute no attempt to understand.If we finish outside the play offs and accrinngton finish inside them. £50 to the charity of choice to SeaSeeEffCee
Exactly, no doubt the underlying data gave the win to Portsmouth tonight.I’d like to politely ask someone to take these stupid charts, roll ‘em up real right, and stick ‘em where the sun don’t shine
That's not how it works but I can see you're going to make absolute no attempt to understand.
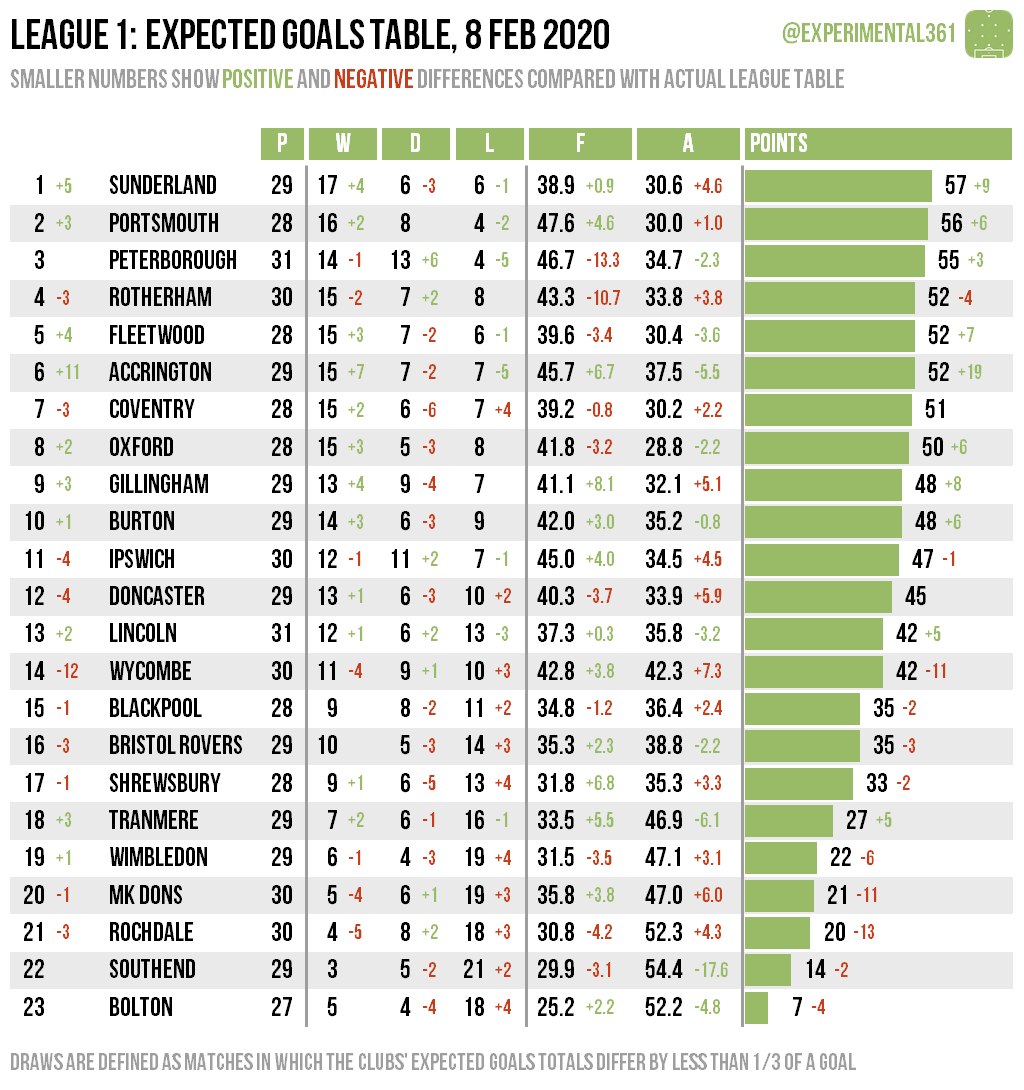
The issue is that you're completely missing the point. No-one is saying that Accrington are going to finish above us. The table isn't supposed to be taken as some gospel 'this is where everyone should be 100%'. But of course everyone sees us in 8th on it and freaks out and shouts about how the data is wrong and can't be trusted without actually understanding it.Even tougher after tonight. It’s not a problem, the offer still stands. Not saying it’s wrong, just saying I will put my money where my mouth is if it comes in . Surely your ok with that ?
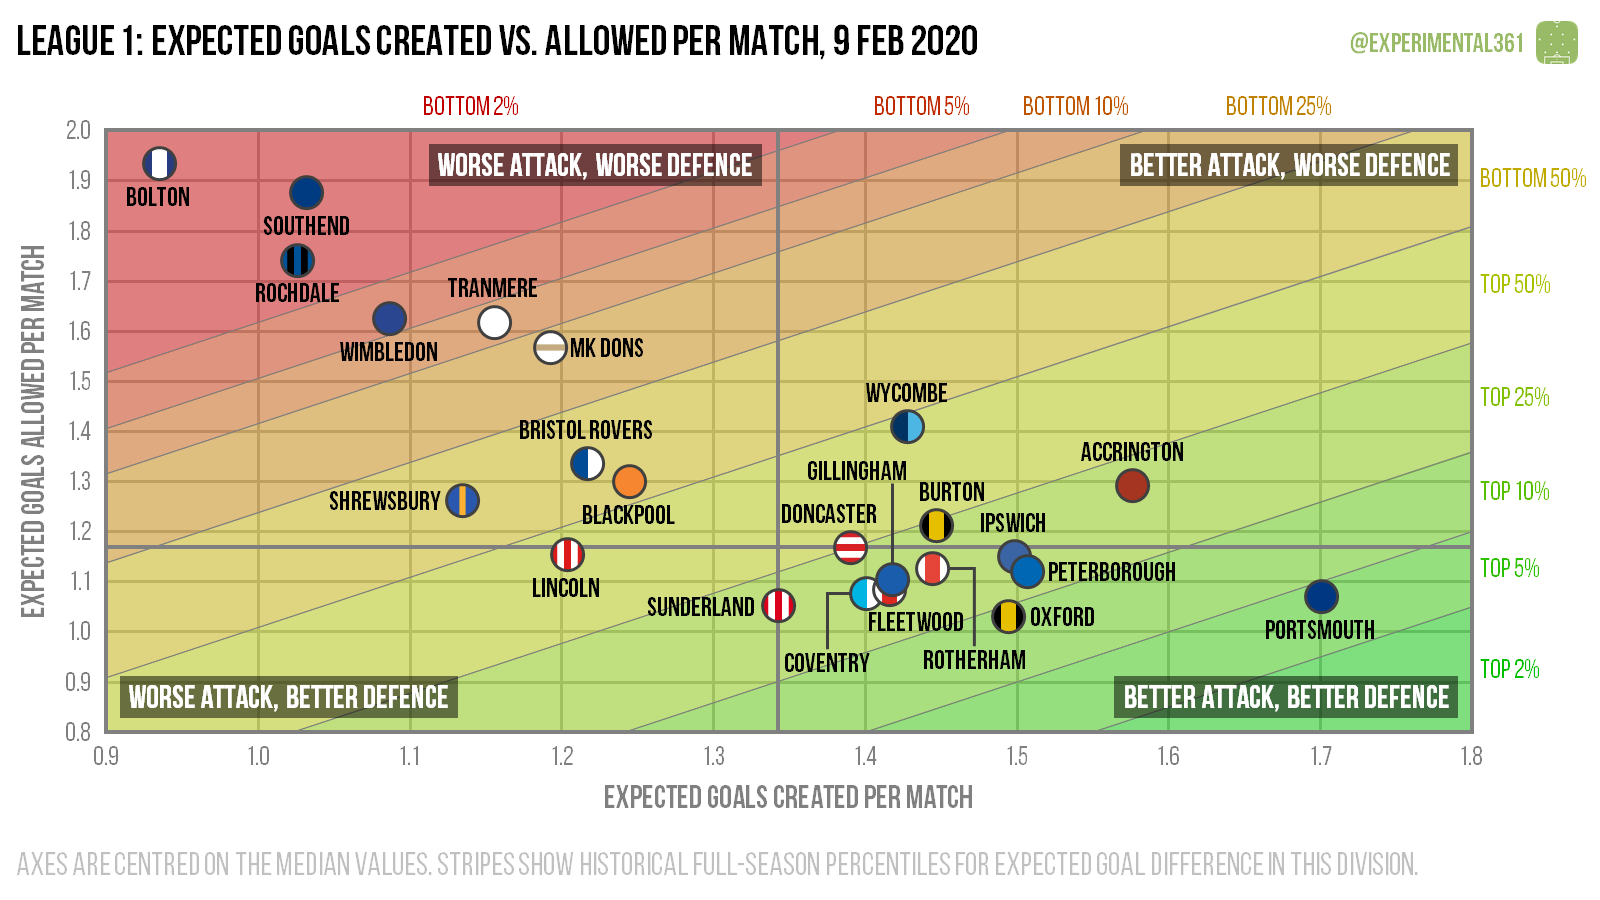
The little circles are prettyThe issue is that you're completely missing the point. No-one is saying that Accrington are going to finish above us. The table isn't supposed to be taken as some gospel 'this is where everyone should be 100%'. But of course everyone sees us in 8th on it and freaks out and shouts about how the data is wrong and can't be trusted without actually understanding it.
")