Performance Graph (1 Viewer)

SkyBlueSoul

Well-Known Member
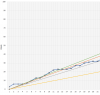
Realised we don't have one of these for this season yet and I had one from last year to use as a template. Averages go back to the 04/05 season. Obviously it's only 5 games in so doesn't mean much atm but I'll try to remember to update it as we go.

Green = Champions
Yellow = 2nd / Autos
Orange = 6th / Play-offs
Red = 21st / Relegation
Blue = City, with points total

Gillingham.png
 

Hobo

Well-Known Member
Now do all the play off teams over the years individually after 5 games.
 

Grendel

Well-Known Member
It’s pointless analysis
 

Hullinho87

Well-Known Member
It’s pointless analysis

It is statistically significant though in that it is based on fact/history/averages etc - so there is a ‘reasonable’ scientific assumption that following an upward trending curve of the green, yellow and orange lines will show progress - fact based on fact.

Your recent opinion on Robins, (whilst I don’t think you used the words ‘statistically correct’) of once being on a downward projectory results wise - doesn’t recover - opinion based on fact.

Data Science will always say fact based on fact supersede’s opinion based on fact.
 

shmmeee

Well-Known Member
All models are wrong. Some models are useful. Seems like a good rule of thumb if nothing else...
 

Grendel

Well-Known Member
It’s pointless as it’s a straight linear calculation without causal factors. We’ve won two games against two of the three poorest teams and that’s a factor to be considered
 

Hullinho87

Well-Known Member
That was my exact point ..

The opinion that because Robins’ team’s never recover after a downward trend and that this time will be the same and he needs to get sacked doesn’t account for many other casual factors.

I genuinely found your opinion interesting none the less as I found this graph interesting, as
Shmmee above says, as a good rule of thumb to track/follow.
 

Captain Dart

Well-Known Member
Nice trajectory.
 

Esoterica

Well-Known Member
We'll have reached the magic 100 points with victory in the 41st game on the current trajectory. Robins to play himself up front with a one legged Biamou for the final 5 games.
 

WhaleOilBeefHooked

Well-Known Member
If nothing else, it just demonstrates what we already knew. City pull it out of the bag for a few games and then it all goes tits up for a couple afterwards! Rinse and repeat.
 

Captain Dart

Well-Known Member
If nothing else, it just demonstrates what we already knew. City pull it out of the bag for a few games and then it all goes tits up for a couple afterwards! Rinse and repeat.
Be interesting to compare with last season. My impression is ... it is very similar so far.
 

oldskyblue58

CCFC Finance Director
so on that basis the current overall trend is to 64 points from 46 matches then ?

Which historically is well short of play off positions.
 

wingy

Well-Known Member
Hey message to Soul OP
You couldn't change the background on the graph could you?
Something light to increase the contrast between the colours please? :)
 

SkyBlueSoul

Well-Known Member
Be interesting to compare with last season. My impression is ... it is very similar so far.
That's a snapshot of last season, keeping it as a thumbnail so it's not confused with this season's. We were 5 points better off at this stage having just lost 1-0 up at Accrington and about to lose 1-0 to FGR.
 

Attachments

  • League 2.png
    League 2.png
    193.8 KB · Views: 59

Captain Dart

Well-Known Member
Have we crossed the grey line. :emoji_grimacing:
 

Captain Dart

Well-Known Member
Just need to keep above that grey line, consistency is the key.
 

Users who are viewing this thread

Top